Code coverage
Last updated on 2026-07-01 | Edit this page
Estimated time: 12 minutes
Overview
Questions
- How do I know which parts of my code my tests actually exercise?
- What does test coverage tell me, and what doesn’t it tell me?
Objectives
Build a project with
gcov/lcovinstrumentation .Run gcovr and interpret line and branch coverage reports
Identify at least one untested branch in the
Histogramimplementation from the coverage reportWrite a test that increases branch coverage and verify the improvement in the report
Explain the difference between line coverage and branch coverage
Describe at least one class of bug that 100% line coverage would not catch
Test coverage
We’ve been adding tests for Histogram and as this has
progressed you might have been thinking “how do I know I’ve tested
everything?”. What you’ve been asking about is test
coverage. We could define several forms of coverage, but in the
context of this lesson, we are going to look at how we can measure which
lines of the code we are testing were actually executed by
tests. This helps us to find both functions we have missed, but also
which branches (e.g. conditionals) are not being exercised by
the tests.
Setting up code and tests to measure coverage
As you might guess, coverage measurement requires instrumenting the
compiled code so a record can be made of which parts actually executed,
and we therefore need to add flags to the build. The simplest way to do
this in CMake is with a new build type. We saw these earlier
when we used CMAKE_BUILD_TYPE with Release and
Debug, and saw they added extra flags to the compile and
link commands. Rather than use a pre-prepared type like these, we’re
going to set one up ourselves to add the flags we’ll need for coverage.
Open up the CMakeLists.txt again and add the lines:
CMAKE
...
# - C++ Standard setup
set(CMAKE_CXX_STANDARD 17)
set(CMAKE_CXX_STANDARD_REQUIRED ON)
set(CMAKE_CXX_EXTENSIONS OFF)

# - Coverage Build Type flags for C++
set(CMAKE_CXX_FLAGS_COVERAGE "-O0 -g --coverage")
...CMake organises compiler flags for C++ and each build type in the following variables:
-
CMAKE_CXX_FLAGS: always applied compiler flags. -
CMAKE_CXX_FLAGS_<TYPE>: additional flags toCMAKE_CXX_FLAGSused in build type<TYPE>.
There are many other ways to set this up, but these are beyond the scope of this lesson.
We’ve explicitly turned off optimization (-O0), added
debugging symbols, and enabled instrumentation for coverage with
--coverage. This flag is supported by both the GCC and
Clang compilers, but others may vary. We can get CMake to handle this,
but again is beyond the scope of this lesson.
We can now configure, build and test using our new
Coverage build type like as we did for
Release:
Note that the argument to CMAKE_BUILD_TYPE is
case-insensitive! We could equally have used coverage or
CoVeRaGe.
When building you should see the flags we defined added to the compile and link:
BASH
(ccptepp-test) $ cmake --build build-coverage
...
[1/4] /usr/bin/c++  -I/tmp/ccptepp-test/src -O0 -g --coverage -std=c++17 -arch arm64 -MD -MT CMakeFiles/ccptepp.dir/src/invariant_mass.cpp.o -MF CMakeFiles/ccptepp.dir/src/invariant_mass.cpp.o.d -o CMakeFiles/ccptepp.dir/src/invariant_mass.cpp.o -c /tmp/ccptepp-test/src/invariant_mass.cpp
...
and tests should run and pass just as before:
BASH
(ccptepp-test) $ ctest --test-dir build-coverage
Test project /tmp/ccptepp-test/build-coverage
    Start 1: TestInvariantMass
1/2 Test #1: TestInvariantMass ................   Passed    0.24 sec
    Start 2: TestHistogram
2/2 Test #2: TestHistogram ....................   Passed    0.14 sec

100% tests passed, 0 tests failed out of 2

Total Test time (real) =   0.39 sec
So far, so much the same, so what has changed? Compiling with
coverage and then running the tests has actually generated two extra
files per .cpp file. We can find these in
build-coverage with:
BASH
(ccptepp-test) $ find build-coverage -name "*.gc*"
build-coverage/CMakeFiles/test_invariant_mass.dir/test/test_invariant_mass.cpp.gcno
build-coverage/CMakeFiles/test_invariant_mass.dir/test/test_invariant_mass.cpp.gcda
build-coverage/CMakeFiles/test_histogram.dir/test/test_histogram.cpp.gcno
build-coverage/CMakeFiles/test_histogram.dir/test/test_histogram.cpp.gcda
build-coverage/CMakeFiles/ccptepp.dir/src/invariant_mass.cpp.gcno
build-coverage/CMakeFiles/ccptepp.dir/src/invariant_mass.cpp.gcda
build-coverage/CMakeFiles/ccptepp.dir/src/histogram.cpp.gcno
build-coverage/CMakeFiles/ccptepp.dir/src/histogram.cpp.gcda
The .gcno files are output by the compiler when
building, and the .gcda files when the programs actually
run. These contain all the information we need about coverage, but are
in binary format so we need a tool to help us make sense of them.
Using gcovr to generate coverage reports
We’re going to use the gcovr
tool to help us make sense of the coverage outputs as it’s the simplest
and easiest to use. It’s preinstalled in our Pixi development
environment so we don’t need any further setup to use it.
To produce a report, [gcovr] needs to know where to find
both the .cpp files and the .gcda outputs
generated for these. If we are running from ccptepp-test/
as we’ve been doing so far, we can thus run gcovr as:
-
--roottellsgcovrwhere to look for source files. - the locations for
.gcdafiles are passed as additional paths at the end.
It will recurse into these directories, so we don’t need to provide multiple nested paths.
By default, gcovr just produces text output to the
terminal, so we’ll see something like
BASH
(ccptepp-test) $ gcovr --root src/ build-coverage/
(INFO) Reading coverage data...
(INFO) Writing coverage report...
------------------------------------------------------------------------------
                           GCC Code Coverage Report
Directory: src
------------------------------------------------------------------------------
File                                       Lines    Exec  Cover   Missing
------------------------------------------------------------------------------
histogram.cpp                                 39      35    89%   24-25,53,55
histogram.hpp                                  0       0    --%
invariant_mass.cpp                             8       7    87%   21
------------------------------------------------------------------------------
TOTAL                                         47      42    89%
------------------------------------------------------------------------------
So we get some details, even which lines are missed. Whilst complete,
we can visualize this a bit more easily by getting gcovr to
output an HTML report:
BASH
(ccptepp-test) $ gcovr --root src/ build-coverage/ --html-details build-coverage/coverage.html
(INFO) Reading coverage data...
(INFO) Writing coverage report...
You can now open build-coverage/coverage.html in your
browser of choice, and you should see:
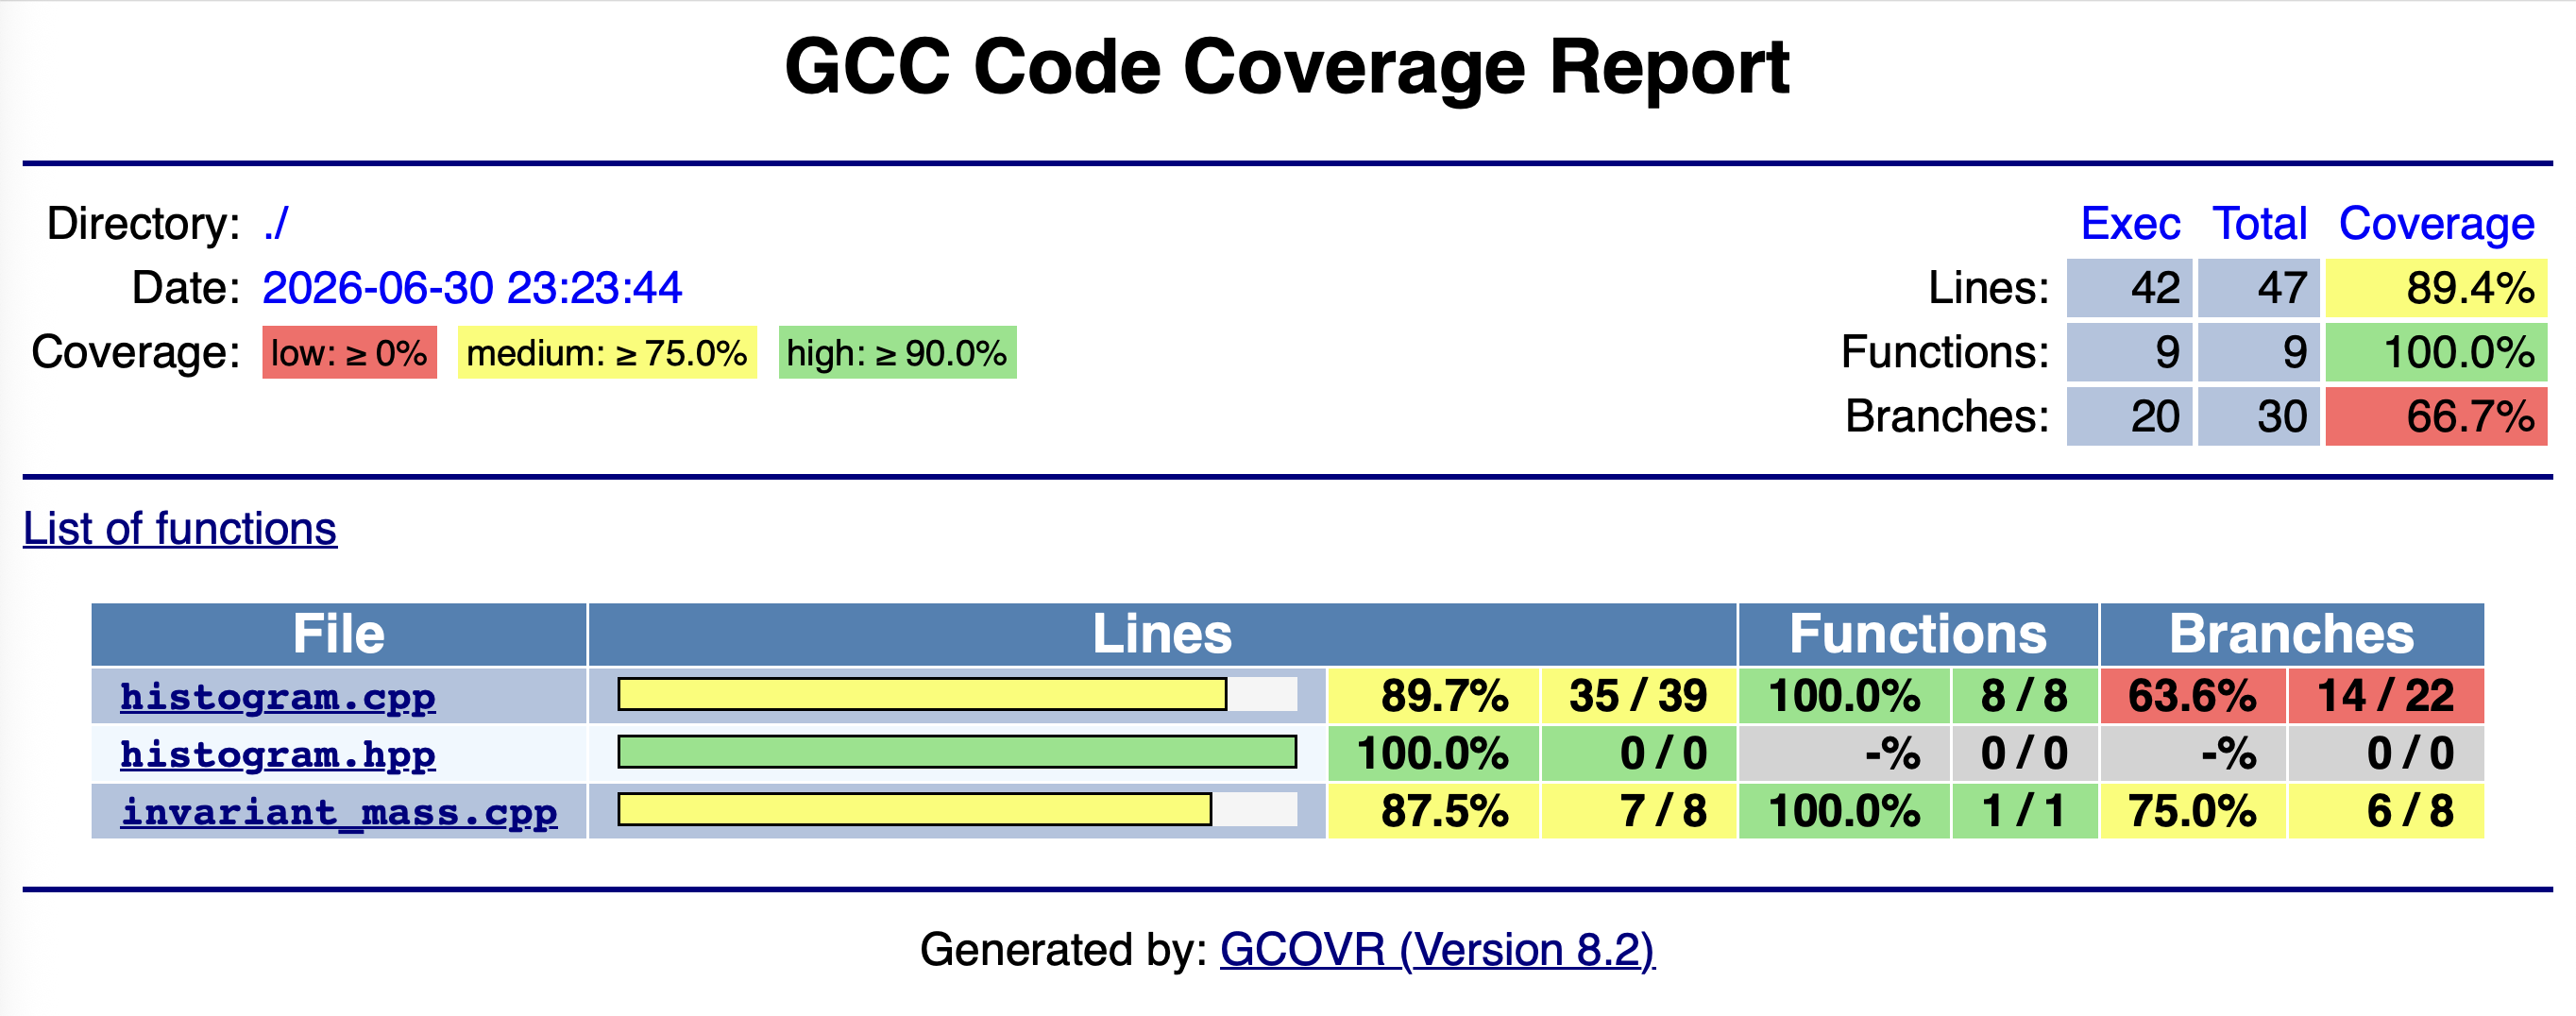
This is basically the same table as printed to terminal, and we see a report for each file under src/:
- Lines: Number of significant lines of code in total and that actually executed.
- Functions: Number of defined functions and how many of these executed.
-
Branches: Similar metric as above, but
branch is quite general here.
- Not just conditionals like
if(), includesfor(),while(), but exception handling, and compiler generated code dealing with them.
- Not just conditionals like
The ratio of actually executed lines/functions/branches to the total
number of each is the coverage for that aspect. We see
that we have 89% line coverage but only 65%
branch coverage of histogram.cpp despite our efforts in
testing, so what’s going on here? Clicking on the filename will take us
to a line-by-line breakdown:
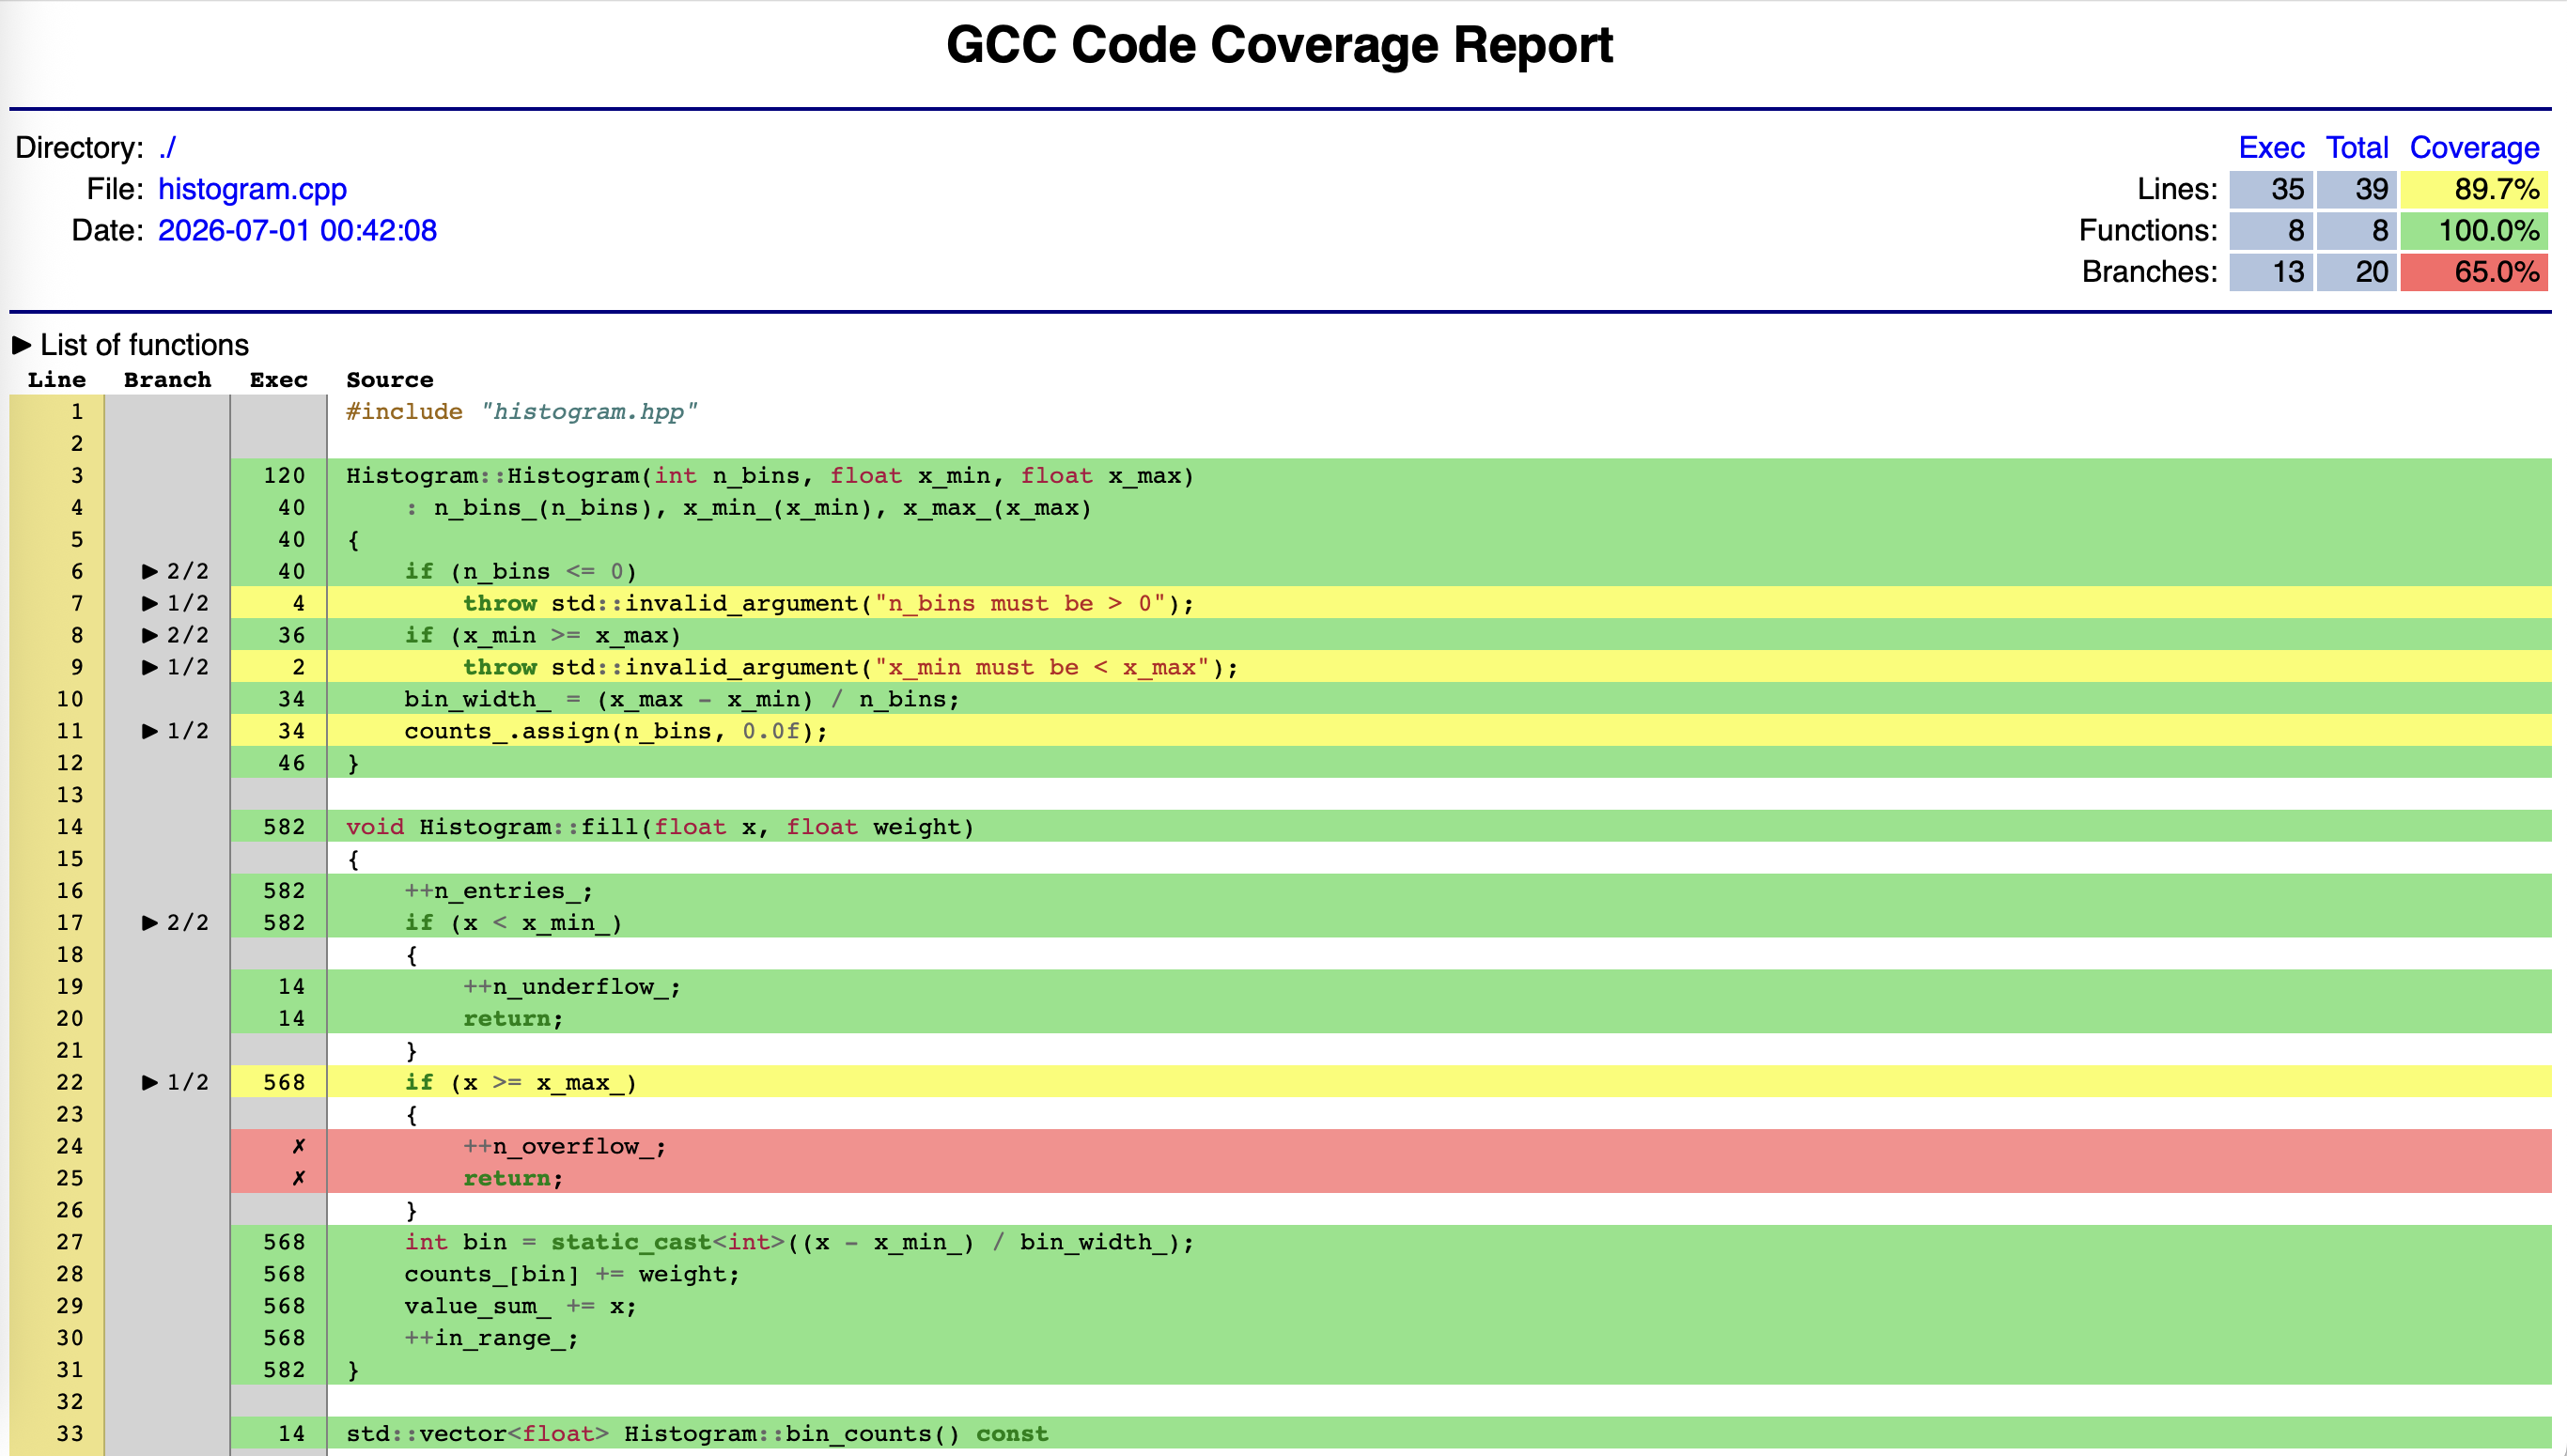
Green lines were executed by at least one test and and red lines were not executed by any test. Yellow lines shows a branch where one or more paths are missing - the branch column shows how many branches within a line were taken. The exec column show the total number of executions of that line.
Missing branches are not necessarily indicative of missing coverage. Look at lines 7, 9, and 34. These are related to the compiler generated code for exception handling - we can see our own branches are covered! This is a general problem with C++, and gcovr’s FAQ covers this in detail.
Allowing for that we can see two definite blocks of red in two different functions that indicate they have not been executed and thus we are missing coverage for them.
Show the fill() function in the HTML report. The line if (x >= x_max_) will appear green — because the line executed — but with incomplete branch coverage, because only the false branch was taken. The lines inside the if block will appear red. This illustrates the difference between line coverage and branch coverage. The if line is green because it ran. But the true branch — the path where x >= x_max_ — was never taken. Line coverage alone would tell us this line is fine. Branch coverage tells us we only tested half of it.
Increasing coverage
Challenge
- Look at the HTML coverage report for your
histogram.cppas tested by yourtest_histogram.cpp. If you have red lines, write test(s) that should result in these lines being executed by that test. - Rebuild and rerun the tests to confirm that they pass, then
regenerate the
gcovrHTML report to confirm the line and branch coverage has increased. - Go back to
histogram.hpp. Does your test correspond to testing any part of the documented specification?
-
As written up to this point we have two gaps:
- We had not called
fillwith a value greater than the histogram’s upper edge. - We had not tried to call
meanon an empty histogram.
The simplest tests would be to implement these in our
HistogramFillTestsuite:CPP
TEST_F(HistogramFillTest, ValueBelowXMinIsUnderflow) { h.fill(10.1f); // above x_max — should be underflow EXPECT_EQ(h.n_overflow(), 1); EXPECT_EQ(h.n_entries(), 1); EXPECT_THAT(h.bin_counts(), ::testing::ContainerEq(std::vector<float>(10, 0.0f))); } TEST_F(HistogramFillTest, MeanOnEmptyHistogramThrows) { EXPECT_THROW(h.mean(), std::runtime_error); } - We had not called
You should be able to get the coverage to around 97.4% on lines and 80% on branches. The remaining lines/branches are likely to be related to the compiler problems we noted earlier. Note at this point that even if you added more tests, the coverage would no longer increase - once a line or branch is covered, it’s covered. More testing covering the same code with different inputs increases confidence/robustness, but not coverage.
Yes! The overflow behaviour was described in the
filldocumentation, and that ofmeanin its own specification. It’s very easy to miss small aspects or some subtlely - measuring coverage gives us a helpful check/reminder here, plus a guide back to parts of the specification we might need to revisit.
Traps and pitfalls with Coverage
Coverage is a very helpful metric to measure, but it needs to be used with care and not in isolation. The first point is simple but critical: coverage tells you a line ran, not that it was tested correctly. Think about the following mistake:
CPP
TEST(HistogramBinEdges, BinEdgesAreCorrect) {
    Histogram h(5, 0.0f, 5.0f);
    h.fill(2.5f);
    h.bin_edges();  // no assertion
}
This would give 100% line and branch coverage for
bin_edges but it tests nothing. Coverage
cannot distinguish a test that checks the result from one that merely
calls the function. A line being green means it ran. It does not mean
the result was correct, or that the tests that executed it would catch a
bug there.
The second trap is related - 100% coverage does not mean all inputs are tested. We touched on this already when we talked about floating point numbers when we talked about boundary conditions providing clear areas for testing, and coverage cannot tell you anything about this.
Even a project of this size we’ve seen getting to 100% coverage is tricky given the difficulties inherent in analysing C++ branches noted above. This only gets harder as project sizes increase, but the good news is that getting from 0% to 80% coverage is typically going to catch the most important tests. Getting from 80% to 95% requires more effort for fewer discoveries. Getting from 95% to 100% can require significant work for code paths that are might be genuinely hard to exercise — like error handling for external failures, or defensive checks that should never trigger in correct usage.
Closing point is that coverage gives us an answer, albeit a limited, specific one, to the question of whether we have tested everything. 100% coverage is not the same as a complete test suite. In particular, neither answer the question of whether we have covered the input parameter (or numerical) space of what we are testing
- Coverage measures which lines and branches were executed during testing — not whether they were tested correctly
- A line shown as covered means it ran; it does not mean the result was checked or that the test would catch a bug there
- Branch coverage is more informative than line coverage — a line can execute without all its branches being taken
- Coverage is a lower bound on thoroughness, not an upper bound — 100% coverage is necessary but not sufficient
- The coverage report is most useful as a guide to where tests are missing, not as a measure of test quality
- Beware of diminishing returns